The heart of this book is the question: How non-speaking people with autism can communicate.The authors detail a potential breakthrough method – Spelling to Communicate (S2C). A brief summary of S2C:a non-speaking person with autism answers questions by pointing to one letter at a time on a letterboard held by an assistant. The reported results are amazing; non-speaking people with autism are able to communicate complex thoughts for the first time. The authors of the book are a father-son pair, the son Jamison is a non-speaker. It touched me how deeply the entire family wanted the best for Jamison. Reading the book, I realized that if my son couldn’t speak, I would certainly embrace S2C.
A major issue with S2C is that it doesn’t land within the domain of current speech therapy science. The best science I can find to support S2C (cited in the book) is by V.K. Jaswal and colleagues at the University of Virginia. It would be great to see some additional supporting papers using other measurement techniques in the neuroscience toolbox. If the results can be substantiated, S2C would be a paradigm shift for non-speaking people with autism. Below is a reference to the paper in question, I would urge those who are interested in the science of S2C to read it.
I searched for a paper that would provide a factual counterbalance. This essay by Stuart Vyse provided some cogent discussion of additional experiments that would affirm or deny the usefulness of S2C.
I’m an engineer but I have spent a few years educating myself in neuroscience. In particular, I have studied advances in brain-computer research. Locked-in quadriplegic patients regain some movement capabilities using brain-computer systems. The best suggestion I have to validate S2C is to develop a system that takes the human assistant out of the loop after some training.
One of my goals for 2022 is to explore Tahoma (Mount Rainier) every month of the year. Why? Because Tahoma is my favorite place to hike and yet I tend to go to the same places over and over. There’s nothing wrong with that: I hope I get to Burroughs Mountain to see the alpine flowers every year I can.
When I did some research, I found an excellent site by Shawn Hargreaves with the handy name of Hiking Tahoma. Shawn is a kindred spirit, he’s laid out a clever interactive map of all the maintained trails on Tahoma. I am now studying what to explore over the year. A few trails that I need to try out: Boundary Trail to Florence Peak, Camp Muir, Eagle Peak, Eastside PCT Loop, Klapatche Park, Northern Loop, South Puyallup Pipe Organ and Tamanos Mountain. I also want to get back to some lesser known trails such as Curtis Ridge. So many hikes, so little time. I feel a need to focus on Tahoma. Along with hiking, I aspire to observe and understand the natural history on each of my hikes.
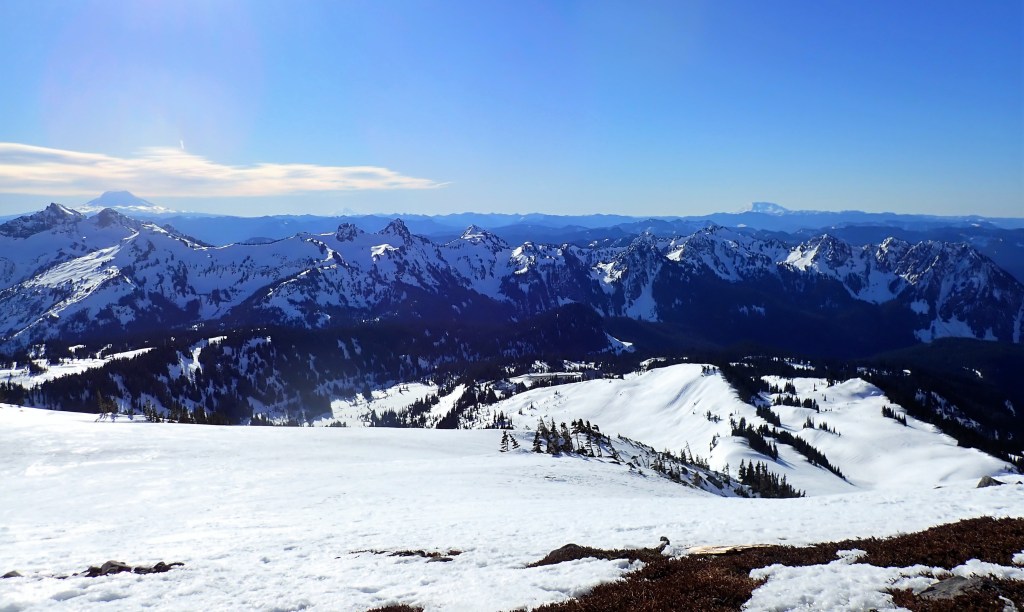
Meanwhile, I did make it to Tahoma on 27 January, 2022. My friend Mike and I had a great day on the mountain. We snowshoed about 5 km (3 miles) with about 400 meters (1400 ft) of elevation gain. As you can see from the photo, we had nice weather. In fact, it was much nicer up here than in the cold, foggy Puget Trough thanks to a temperature inversion. It was a four volcano day: Tahoma, Adams, Hood, and Mount St Helens were all visible. If you look near the upper right corner, I think you can see the road where we started far below.
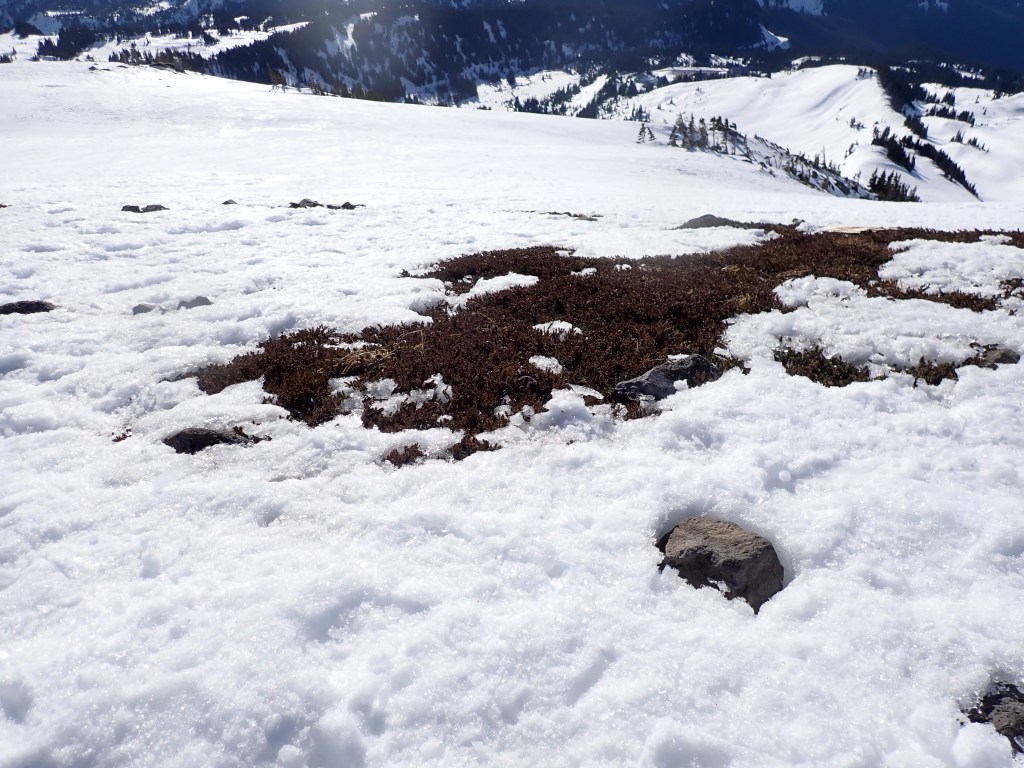
I was able to see a few plants and trees along the way. Here are my naturalist observations for 24 January 2022. My plant of the day was a patch of common juniper growing in a rocky, windswept areas at 2000 meter (6600 feet). This was our lunch spot.
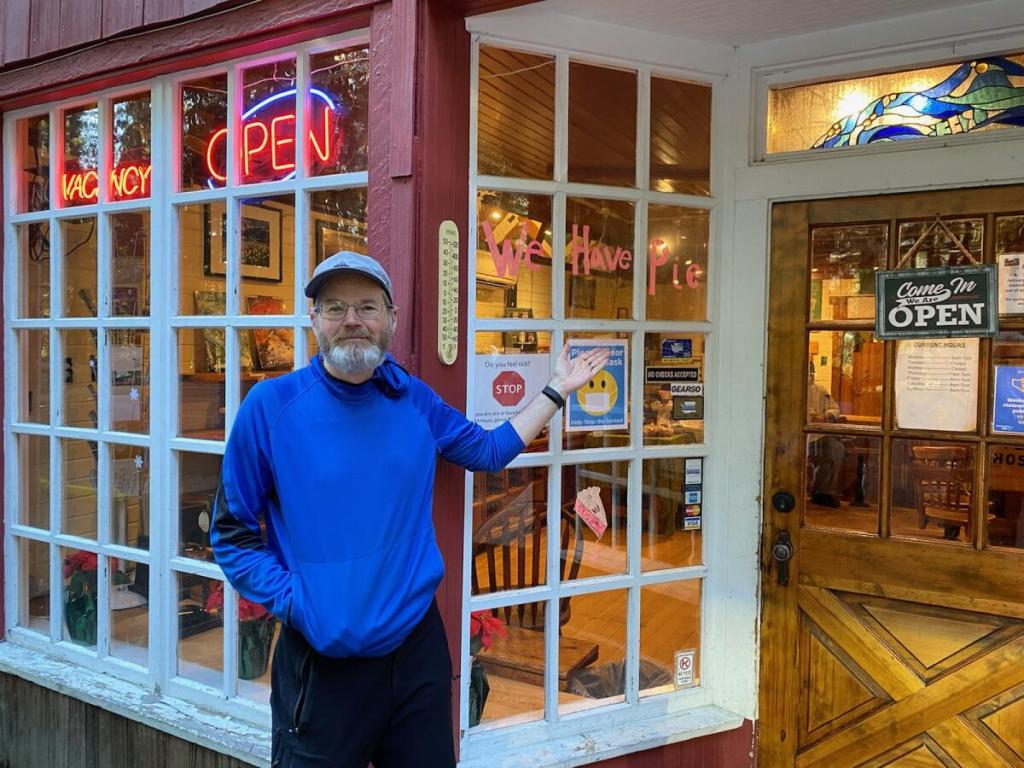
We worked pretty hard heading up. Coming down , we were able to get in a couple of glissades ( in other words, slide on our butts in the snow done some steep slopes). After some hard work, I was happy to stop at the Copper Creek Restaurant and see WE HAVE PIES. Specifically, delicious blackberry pie. Hmm, there may have been ice cream as well.
“Chains of habit are too light to be felt until they are too heavy to be broken.”
Warren Buffett
I’ve got a habit. I walk, hike and run a fair amount every day. Perhaps my favorite activity is to hike – at some speed between a trot and a gallop. I also love numbers and have used a pedometer to keep track of my miles walked each day for the last ten years: 2012 to 2021. I made spreadsheets each year and have looked at the data trends over each week and each month of a year. This is an update from my previous post Quantifying Hiking and Running Part 1 with eight years of data.
Thus, I have now accumulated ten years of walking data:
Table 1: Yearly Mileage
Year
Miles
Age
2021
3001
63
2020
4347
62
2019
3174
61
2018
3387
60
2017
3286
59
2016
2754
58
2015
3117
57
2014
3008
56
2013
2634
55
2012
2470
54
Table 1 shows the sum of my walking (in miles) for each month of the last ten years:
Year
Jan
Feb
Mar
Apr
May
Jun
Jul
Aug
Sep
Oct
Nov
Dec
Year Total
2021
259
233
280
227
241
342
238
259
236
240
212
234
3001
2020
235
220
261
283
490
589
580
607
263
251
268
300
4347
2019
301
241
289
242
238
250
273
269
276
280
274
242
3175
2018
318
271
315
252
304
315
272
338
229
301
240
232
3387
2017
256
296
298
259
286
295
288
283
214
291
281
240
3287
2016
187
188
193
215
206
225
238
267
267
305
269
194
2754
2015
245
258
260
244
266
281
247
306
255
250
237
269
3118
2014
224
211
239
206
212
253
282
302
265
267
275
273
3009
2013
210
190
208
229
243
238
256
220
221
209
199
211
2634
2012
147
201
184
192
242
238
245
190
200
213
202
214
2470
Average
238
231
253
235
273
303
292
304
243
261
246
241
3118
Table 1: Miles walked per month, 2012 to 2021
I also like to see the cumulative amount I have walked each month over the course of a year. Table 2 summarizes my walking progress each month over the course of a year:
Year
Jan
Feb
Mar
Apr
May
Jun
Jul
Aug
Sep
Oct
Nov
Dec
2021
259
492
772
999
1240
1582
1820
2079
2315
2555
2767
3001
2020
235
455
716
999
1489
2078
2658
3265
3528
3779
4047
4347
2019
301
542
831
1073
1311
1561
1834
2103
2379
2659
2933
3175
2018
318
589
904
1156
1460
1775
2047
2385
2614
2915
3155
3387
2017
256
552
850
1109
1395
1690
1978
2261
2475
2766
3047
3287
2016
187
375
568
783
989
1214
1452
1719
1986
2291
2560
2754
2015
245
503
763
1007
1273
1554
1801
2107
2362
2612
2849
3118
2014
224
435
674
880
1092
1345
1627
1929
2194
2461
2736
3009
2013
210
400
608
837
1080
1318
1574
1794
2015
2224
2423
2634
2012
147
348
532
724
966
1205
1450
1640
1840
2053
2255
2470
31182
Total
Table 2: Cumulative Miles Walked per Month, 2012 to 2021
The total over ten years is 31,182 miles or 50,186 km. That’s an average of 260 miles or 418 km a month.
A few things worth pointing out:
First, I had my biggest walking year in 2020 – during the COVID pandemic I walked 4347 miles (6996 km). The reason for this high mileage was I entered the Great Virtual Race Across Tennessee 1000K race. In this four month long virtual race, I covered 1907 miles ( 3069 km) from May through August. Another way I covered miles in 2020 was by walking and running every street in my town. One reason I covered many miles was to see what it would be like to hike the Appalachian Trail – a goal of mine that I thought I might do in 2020 or 2021.
Next, for six years I covered was in the 3000 mile (3001-3387 mi; 4829-5451 km) range. I first broke 3000 miles in 2014 and again in 2015. I was able to cover more than 3000 miles again from 2017 to the present. I started trail running in 2017. I was able to complete the Badger Mountain 50 mile race; it was slow and steady. Another 2017 challenge was finishing the Issy Alps 50k, that was far tougher than the Badger Mountain race for me.
In 2018, I tried twice to run 100 mile races: Badger Mountain 100 (69 miles) and Bryce Canyon 100 (81 miles). While I didn’t complete them, I learned much. I still think I may do a 100 mile distance,, however, my current thought would be to walk rather than run. From 2017 to the present, I have had some great hiking, fastpacking and backpacking adventures with my friends.
My favorite year was 2015. I achieved no major milestones in running, backpacking or hiking. What I did accomplish was to recover from surgery on my esophagus to treat achalasia, a rare disease that I have. Achalasia has been a challenge for me. There is no cure or much known about the disease. Thanks to the work of my medical team, lead by thoracic surgeon Dr. Brian Louie, I was able to return to a vigorous life. My view going forward after my January, 2015 surgery has been “carpe diem, quam minimum credula postero” (“Seize the day, put very little trust in the future.”) As an achalasia patient, I am grateful to be able to explore the world by covering as many miles as I can.
I had some low mile years. Why? For 2012 and 2013, the answer was full-time work got in the way of walking. I was able to retire from full-time work in September, 2013. I did some part-time work in 2014 and 2015 as well as attending college to learn biology, From 2016 to the present, I have been active in volunteer work at some non-profits but have much more time to spend outdoors.
My worst year was 2016. It wasn’t the lowest mile year but it was the most annoying. I kept injuring my right knee, then my right hip, then my left knee, then my right knee. I think there were two things that caused these problems. I was running a lot on hard surfaces ( I was training to run the Philadelphia Marathon with my brother). More important, the muscles of my right knee were much weaker than my left knee – which I figured out with the help of my doctor in December, 2016. So, after 2016 I minimized running on hard surfaces, started strength training and switched from cushioned shoes to zero drop trail running shoes. The important lesson for me: Avoid injuries if you want to cover miles.
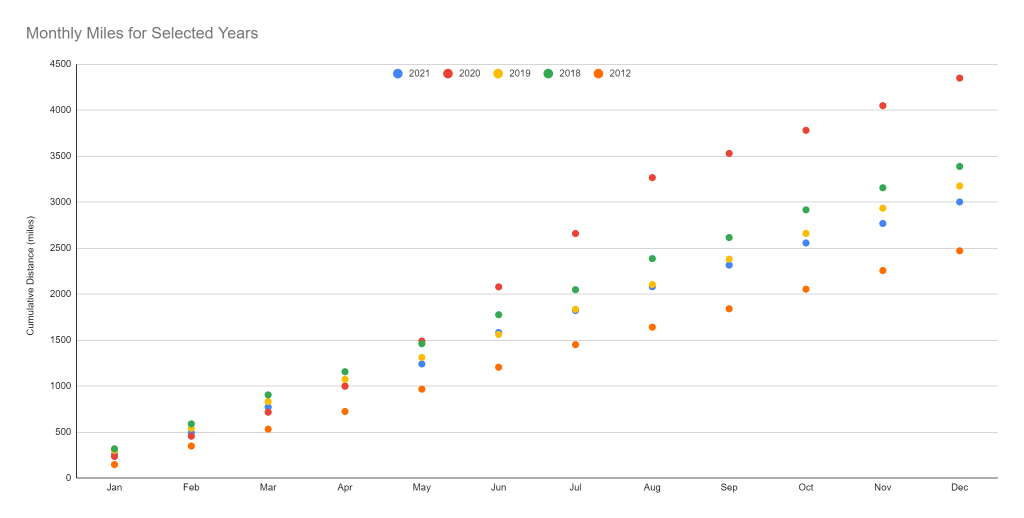
Figure 1: Cumulative monthly miles for selected years 2012, and 2018 to 2021
Figure 1 illustrates how I’ve done over the last ten years. The bottom set of points are from 2012; my lowest mileage year. The top set of points are for 2020; my highest mileage year. There are three sets of data in a range in between the lowest and highest. These are years 2018, 2019, and 2020.
I want to write in the future about my daily tracking methods – many times the fact that I was behind my goal got me motivated to do more miles. What I do every single day is how I cover many miles in a year. Another useful topic is how walking has affected my health; in general it’s been very positive but I ought to write my lessons learned.
Let me close by thanking all my friends and family who have put in miles with me. I always enjoy the company; hopefully you do as well. Of course, sometimes I have an excessive number of words per mile! Well, I have to dash off now; got a few miles to cover today.
Here’s the transcript, any errors are likely due to my poor hearing and typing.
Matt Egan > What do you think of the framework for Build Back Better? This 1.75 trillion-dollar spending bill that the Democrats have put out calls for taxing share buybacks, putting a 1% surcharge on share buybacks. Is that a good idea?
Charlie Munger > I think it’s insane. Literally insane.
Matt Egan > Why?
Charlie Munger > I think it’s so irrational and I think it sort of destroys the whole system once you start tinkering from Washington. I don’t think the dividend policies of American corporations should be determined from Washington.
Matt Egan > Do you think that the criticism that buy backs have some cases got out of hand; is that criticism fair?
Charlie Munger > No.
Matt Egan > I’ve got to ask you about some of the comments you made recently to CNBC about China praising the regulators there in China, their financial regulators.I’m just wondering whether or not you regret any of those comments regarding China?
Charlie Munger > Regret it? I would regret not making them. China, recognizing the horrible troubles that come with letting booms get too big; steps on a boom in the middle of it instead of waiting until the very end and the big bust. Of course, I admire that. In that one respect, they are wiser than we are.
It amuses me that communist China is being smarter about handling booms than capitalist America. But I know a lot of people that are smarter than I am. Should we not have a nation sometimes that’s smarter than ours in some respects?
Matt Egan > Aren’t there also problems when it comes to China with respect to human rights and just the undemocratic system that they have there?
Charlie Munger > Well, it’s true that I prefer my own system. But considering the problem that China had I would argue that their system has worked out better for them than our system has for us.
They had a horrible overpopulation problem and they had dire poverty. They had a problem we didn’t have. They have needed tougher methods than we could use in our own Constitution and I would argue that they were lucky the government system they had at the time they had their overpopulation problem. I don’t think we should assume that every other nation in the world no matter what the problems are, should have our type of government. I think that is sort of pompous and self-centered.
Ours is right for us but maybe there’s is right for them you know it’s one of the most remarkable achievements in the history of the human race what the Chinese have accomplished in the last 30 years.
Opinion:
I was primarily interested in Munger’s remarks regarding China. I have to agree with Charlie Munger, the transformation of China into the second largest economy in the world is quite remarkable. I have included a table of all the countries in the world with a 2021 GP that’s estimated to be greater than one trillion US dollars along with a map. It makes me wonder, why the List of Nobel Memorial Prize laureates in Economics has no Chinese economists?
English: World map of countries by nominal GDP in 2019.
Rank
Country
GDP (USD)
1
United States
22.7
2
China
16.6
3
Japan
5.4
4
Germany
4.3
5
United Kingdom
3.1
6
India
3.0
7
France
2.9
8
Italy
2.1
9
Canada
1.9
10
South
1.8
11
Russia
1.7
12
Australia
1.6
13
Brazil
1.5
14
Spain
1.5
15
Mexico
1.2
16
Indonesia
1.2
17
Netherlands
1.0
2021 GDP (Trillions of US Dollars) based on IMF data
GDP table was based on data from Wikipedia List of countries by GDP (nominal) accessed 7 November 2021 My expertise using tables and images in Word Press is poor. In particular, I was unable to include the color coded captions from the Wikipedia image of GDP by country and so I included an additional table.