I watched a YouTube presentation by Dr. Greger that introduces his new book “How Not to Age” and decided I would make a few notes. The book will be released on 5 December 2023 and I plan to read it. One thing led to another and now I have a pretty detailed set of notes on this presentation that I think might be useful to others. This is part 1 of a series of posts, it covers the first 21 minutes of the talk. If there are errors in this post, they are likely mine, let me know and I will correct it. I learned a couple of things from this talk:
1. increase my intake of foods that contain spermidine; I am adding wheat germ to my diet every day.
2. Investigate fasting to increase autophagy [11]
3. When possible, try to exercise for 60 minutes or longer [13]
4. Can’t wait to read the book but I also wanted to read a few of the papers.
I researched the citations to some of the papers that Dr. Greger cites in the talk. One reason I did this is to keep up with the sheer volume of research that he uses in the talk; he covers a lot of ground. It was interesting to see that some of the papers cited in his talk aren’t included in “How Not to Age”.
Notes for Part 1
- Centenarians die of disease; not old age
- Aging kills via disease, why wasn’t “How Not to Die” a good enough book?
- BUT rate of death increases exponentially as we age
- Risk doubles about every 7 years
- Age is the leading risk factor for disease
- Cholesterol is a modifiable risk factor
- What if the rate of aging was modifiable?
- BUT rate of death increases exponentially as we age
- Slowing down the rate of aging would address risk from many diseases.
- Anti-aging schemes unscrupulous (at best)
- Need to rely on evidence, not anecdotes
- “How Not to Age” has over 13,000 citations (see How Not to Age Citations)
- “My aim was to cover every possible angle for developing the optimal diet and lifestyle for the longest, healthiest lifespan based on the best available balance of evidence.” Dr. Greger’s goal
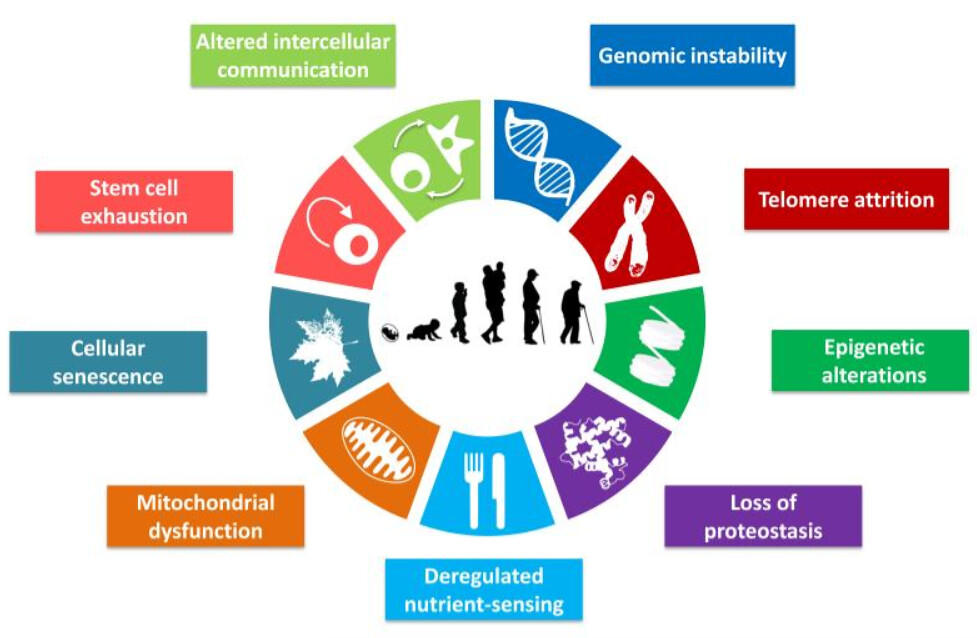
- Experts such as Valter Longo and David Sinclair have identified essential pathways that can be modified by drugs [1]
- Dr. Greger realized these eleven pathways can be modified via diet
- Part 1“Slowing Aging by Blocking Eleven Pathways to Aging”
- The phrase “anti-aging” is greatly abused in popular culture, often for the purpose of marketing cosmetic procedures or unproven nutritional supplements purported to slow or reverse aging. This has the unfortunate consequence of creating confusion among the general public and diminishing the impact of legitimate scientific discovery. Here, we define “anti-aging” as delaying or reversing biological aging by targeting the established molecular mechanisms of aging, which have been formalized as “hallmarks” or “pillars” of aging. [2]
Hallmarks of Aging
- [7:30] Autophagy “Self-eating” housekeeping process by which defective cellular components are scrapped for spare parts clearing out damage implicated in aging process
- Autophagy, a term acquired from the Greek words “auto (self)” and “phagein (to eat)”, literally meaning “self-eating”, refers to an evolutionary conserved catabolic mechanism that allows cells to remove their own unnecessary or dysfunctional components.[4]
- Autophagy critical for lifespan and healthspan extension
- Proteostasis is supported by autophagy, a conserved machinery that helps to eliminate dysfunctional proteins and cellular organelles via lysosomal degradation. The rejuvenating power of cleaning up garbage and replacing it with recycled and newly synthesized cellular components speaks to the imagination and is an attractive explanation for the positive correlation between autophagy and lifespan.[5]
- …. mounting evidence suggesting that autophagy is not only necessary but, at least in some cases, also sufficient for increasing longevity.[6]
- …. specific activation of autophagy through a mutation in beclin 1 prolongs median survival by approximately 12% in both male and female mice. [7]
- A decrease in autophagy with age has been described in almost all organisms and tissues analyzed.[8]
- Pharma wants to exploit autophagy using drugs
- To circumvent such diseases of aging, efforts to pharmacologically modulate autophagy are at the forefront of multiple research programs in academia and the pharmaceutical industry.[9]
- Fasting can cause autophagy [10]
- Don’t fast longer than 24 hours without medical help
- Fasting periods lasting longer than 24 hours and particularly those lasting 3 or more days should be done under the supervision of a physician and preferably in a clinic.[11]
- Exercise can cause autophagy [12]
- Activated after more than 60 minutes of moderate exercise
These data demonstrate that autophagy signaling is activated in human skeletal muscle after 60 min of exercise, independently of nutritional status, and suggest that initiation of autophagy constitutes an important physiological response to exercise in humans.[13]
- Activated after more than 60 minutes of moderate exercise
- Diet can inhibit autophagy
- Acrylamide – in deep fried foods (fries, chips) causes inflammation [14][15]
- Put it to the test – some evidence
- Air frying is better [16]
- Coffee (including decaf) can activate autophagy [17]
- Bioactive compounds other than caffeine
- Chlorogenic acids (CGA)
- Bioactive compounds other than caffeine
- Spermidine rich foods activate autophagy[18]
- Levels decline with age (except in naked mole rats which don’t age [19])
- Largest documented lifespan extension [20]
- Improves cardiac, [21] immune, [22] and brain function in animals
- In humans, greatest consumption of spermidine has lowest mortality[24]
- An anti-aging vitamin to maintain autophagy
In sum, in our view, spermidine is synthesized by our organism in sufficient quantities during youth, but not in old age. Thus, one may argue that, as we age, spermidine evolves to the status of a vitamin, and thus has to be supplemented from external sources to secure the maintenance of autophagic flux required for organismal homeostasis. [25]

- Wheat germ is the most concentrated source of spermidine, 2.5 mg per tablespoon
- Caused improvement in mild dementia patients
- Work much better than Aducanumab anti-Alzheimer drug
- Autophagy Takeaways (summary from “How Not to Age”)[26]
To help slow this aging pathway, on a daily basis, consider.- 60 min or more of moderate to vigorous (55%-70% VO2 max) aerobic exercise
- minimizing your intake of french fries and potato chips
- drinking three cups of regular or decaffeinated coffee
- trying to consume at least 20 mg of spermidine by incorporating foods such as tempeh, mushrooms, peas, and wheat germ into your diet
- instituting the recommendations to activate AMPK (see chapter 1)
- following the recommendations to suppress mTOR (see chapter 8) “How Not to Age” diet and lifestyle takeaways for 10 other aging pathways
References
- [1] Longo VD, Antebi A, Bartke A, Barzilai N, Brown-Borg HM, Caruso C, Curiel TJ, de Cabo R, Franceschi C, Gems D, Ingram DK, Johnson TE, Kennedy BK, Kenyon C, Klein S, Kopchick JJ, Lepperdinger G, Madeo F, Mirisola MG, Mitchell JR, Passarino G, Rudolph KL, Sedivy JM, Shadel GS, Sinclair DA, Spindler SR, Suh Y, Vijg J, Vinciguerra M, Fontana L. Interventions to Slow Aging in Humans: Are We Ready? Aging Cell. 2015 Aug;14(4):497-510. doi: 10.1111/acel.12338. Epub 2015 Apr 22. PMID: 25902704; PMCID: PMC4531065 https://pubmed.ncbi.nlm.nih.gov/25902704/ Not referenced in How Not to Age Citations
- [2] Lee MB, Hill CM, Bitto A, Kaeberlein M. Antiaging diets: Separating fact from fiction. Science. 2021 Nov 19;374(6570):eabe7365. doi: 10.1126/science.abe7365. Epub 2021 Nov 19. PMID: 34793210; PMCID: PMC8841109. PMC8841109. https://www.ncbi.nlm.nih.gov/pmc/articles/PMC8841109/ Cited as references 108, 7648, 7784 and 7996 in How Not to Age Citations
- [3] López-Otín C, Blasco MA, Partridge L, Serrano M, Kroemer G. The hallmarks of aging. Cell. 2013 Jun 6;153(6):1194-217. doi: 10.1016/j.cell.2013.05.039. PMID: 23746838; PMCID: PMC3836174. https://www.ncbi.nlm.nih.gov/pmc/articles/PMC3836174/ Cited as reference 142 and 556 in How Not to Age Citations
- [4] Pietrocola F, Bravo-San Pedro JM. Targeting Autophagy to Counteract Obesity-Associated Oxidative Stress. Antioxidants (Basel). 2021 Jan 12;10(1):102. doi: 10.3390/antiox10010102. PMID: 33445755; PMCID: PMC7828170. https://www.ncbi.nlm.nih.gov/pmc/articles/PMC7828170/ Not referenced in How Not to Age Citations
- [5] Dantuma NP, Hoppe T, Herzog LK. The price of longevity. Aging (Albany NY). 2020 Nov 28;12(22):22350-22351. doi: 10.18632/aging.104215. Epub 2020 Nov 28. PMID: 33253121; PMCID: PMC7746350. https://www.ncbi.nlm.nih.gov/pmc/articles/PMC7746350/ Not referenced in How Not to Age Citations
- [6] Madeo F, Zimmermann A, Maiuri MC, Kroemer G. Essential role for autophagy in life span extension. J Clin Invest. 2015 Jan;125(1):85-93. doi: 10.1172/JCI73946. Epub 2015 Jan 2. PMID: 25654554; PMCID: PMC4382258. https://www.ncbi.nlm.nih.gov/pmc/articles/PMC4382258/ Cited as references 240 and 257 in How Not to Age Citations
- [7] Arensman MD, Eng CH. Self-Digestion for Lifespan Extension: Enhanced Autophagy Delays Aging. Mol Cell. 2018 Aug 16;71(4):485-486. doi: 10.1016/j.molcel.2018.08.002. PMID: 30118677. https://linkinghub.elsevier.com/retrieve/pii/S1097-2765(18)30636-1 Not referenced in How Not to Age Citations
- [8] Cuervo AM. Calorie restriction and aging: the ultimate “cleansing diet”. J Gerontol A Biol Sci Med Sci. 2008 Jun;63(6):547-9. doi: 10.1093/gerona/63.6.547. PMID: 18559626. https://academic.oup.com/biomedgerontology/article-lookup/doi/10.1093/gerona/63.6.547 Cited as references 239, 243 and 249 in How Not to Age Citations
- [9] Wong SQ, Kumar AV, Mills J, Lapierre LR. Autophagy in aging and longevity. Hum Genet. 2020 Mar;139(3):277-290. doi: 10.1007/s00439-019-02031-7. Epub 2019 May 30. PMID: 31144030; PMCID: PMC6884674. https://www.ncbi.nlm.nih.gov/pmc/articles/PMC6884674/ Cited as reference 242 in How Not to Age Citations
- [10] Mani K, Javaheri A, Diwan A. Lysosomes Mediate Benefits of Intermittent Fasting in Cardiometabolic Disease: The Janitor Is the Undercover Boss. Compr Physiol. 2018 Sep 14;8(4):1639-1667. doi: 10.1002/cphy.c180005. PMID: 30215867; PMCID: PMC6423516.https://www.ncbi.nlm.nih.gov/pmc/articles/PMC6423516/ Cited as references 7661 in How Not to Age Citations
- [11] Longo VD, Mattson MP. Fasting: molecular mechanisms and clinical applications. Cell Metab. 2014 Feb 4;19(2):181-92. doi: 10.1016/j.cmet.2013.12.008. Epub 2014 Jan 16. PMID: 24440038; PMCID: PMC3946160. https://www.ncbi.nlm.nih.gov/pmc/articles/PMC3946160/ Cited as references 7598 and 7837 in How Not to Age Citations
- [12] He C, Sumpter R Jr, Levine B. Exercise induces autophagy in peripheral tissues and in the brain. Autophagy. 2012 Oct;8(10):1548-51. doi: 10.4161/auto.21327. Epub 2012 Aug 15. PMID: 22892563; PMCID: PMC3463459. https://www.ncbi.nlm.nih.gov/pmc/articles/PMC3463459/ Not referenced in How Not to Age Citations
- [13] Møller AB, Vendelbo MH, Christensen B, Clasen BF, Bak AM, Jørgensen JO, Møller N, Jessen N. Physical exercise increases autophagic signaling through ULK1 in human skeletal muscle. J Appl Physiol (1985). 2015 Apr 15;118(8):971-9. doi: 10.1152/japplphysiol.01116.2014. Epub 2015 Feb 12. PMID: 25678702. https://journals.physiology.org/doi/10.1152/japplphysiol.01116.2014 Not referenced in How Not to Age Citations
- [14] Song D, Xu C, Holck AL, Liu R. Acrylamide inhibits autophagy, induces apoptosis and alters cellular metabolic profiles. Ecotoxicol Environ Saf. 2021 Jan 15;208:111543. doi: 10.1016/j.ecoenv.2020.111543. Epub 2020 Nov 9. PMID: 33396091. https://www.sciencedirect.com/science/article/pii/S0147651320313804 Cited as reference 253 in How Not to Age Citations
- [15] Naruszewicz M, Zapolska-Downar D, Kośmider A, Nowicka G, Kozłowska-Wojciechowska M, Vikström AS, Törnqvist M. Chronic intake of potato chips in humans increases the production of reactive oxygen radicals by leukocytes and increases plasma C-reactive protein: a pilot study. Am J Clin Nutr. 2009 Mar;89(3):773-7. doi: 10.3945/ajcn.2008.26647. Epub 2009 Jan 21. Erratum in: Am J Clin Nutr. 2009 Jun;89(6):1951. PMID: 19158207. https://linkinghub.elsevier.com/retrieve/pii/S0002-9165(23)23747-8 Cited as reference 253 in How Not to Age Citations
- [16] Sansano M, Juan-Borrás M, Escriche I, Andrés A, Heredia A. Effect of pretreatments and air-frying, a novel technology, on acrylamide generation in fried potatoes. J Food Sci. 2015 May;80(5):T1120-8. doi: 10.1111/1750-3841.12843. Epub 2015 Apr 13. PMID: 25872656. Not referenced in How Not to Age Citations
- [17] Pietrocola F, Malik SA, Mariño G, Vacchelli E, Senovilla L, Chaba K, Niso-Santano M, Maiuri MC, Madeo F, Kroemer G. Coffee induces autophagy in vivo. Cell Cycle. 2014;13(12):1987-94. doi: 10.4161/cc.28929. Epub 2014 Apr 25. PMID: 24769862; PMCID: PMC4111762. Cited as reference 255 in How Not to Age Citations
- [18] Madeo F, Eisenberg T, Büttner S, Ruckenstuhl C, Kroemer G. Spermidine: a novel autophagy inducer and longevity elixir. Autophagy. 2010 Jan;6(1):160-2. doi: 10.4161/auto.6.1.10600. PMID: 20110777. Not referenced in How Not to Age Citations
- [19] Viltard M, Durand S, Pérez-Lanzón M, Aprahamian F, Lefevre D, Leroy C, Madeo F, Kroemer G, Friedlander G. The metabolomic signature of extreme longevity: naked mole rats versus mice. Aging (Albany NY). 2019 Jul 24;11(14):4783-4800. doi: 10.18632/aging.102116. PMID: 31346149; PMCID: PMC6682510. Cited as reference 323 in How Not to Age Citations
- [20] Eisenberg T, Knauer H, Schauer A, Büttner S, Ruckenstuhl C, Carmona-Gutierrez D, Ring J, Schroeder S, Magnes C, Antonacci L, Fussi H, Deszcz L, Hartl R, Schraml E, Criollo A, Megalou E, Weiskopf D, Laun P, Heeren G, Breitenbach M, Grubeck-Loebenstein B, Herker E, Fahrenkrog B, Fröhlich KU, Sinner F, Tavernarakis N, Minois N, Kroemer G, Madeo F. Induction of autophagy by spermidine promotes longevity. Nat Cell Biol. 2009 Nov;11(11):1305-14. doi: 10.1038/ncb1975. Epub 2009 Oct 4. PMID: 19801973. Cited as reference 319 in How Not to Age Citations
- [21] Eisenberg T, Abdellatif M, Schroeder S, Primessnig U, Stekovic S, Pendl T, Harger A, Schipke J, Zimmermann A, Schmidt A, Tong M, Ruckenstuhl C, Dammbrueck C, Gross AS, Herbst V, Magnes C, Trausinger G, Narath S, Meinitzer A, Hu Z, Kirsch A, Eller K, Carmona-Gutierrez D, Büttner S, Pietrocola F, Knittelfelder O, Schrepfer E, Rockenfeller P, Simonini C, Rahn A, Horsch M, Moreth K, Beckers J, Fuchs H, Gailus-Durner V, Neff F, Janik D, Rathkolb B, Rozman J, de Angelis MH, Moustafa T, Haemmerle G, Mayr M, Willeit P, von Frieling-Salewsky M, Pieske B, Scorrano L, Pieber T, Pechlaner R, Willeit J, Sigrist SJ, Linke WA, Mühlfeld C, Sadoshima J, Dengjel J, Kiechl S, Kroemer G, Sedej S, Madeo F. Cardioprotection and lifespan extension by the natural polyamine spermidine. Nat Med. 2016 Dec;22(12):1428-1438. doi: 10.1038/nm.4222. Epub 2016 Nov 14. PMID: 27841876; PMCID: PMC5806691 https://www.ncbi.nlm.nih.gov/pmc/articles/PMC5806691/ Cited as references 325, 327. 336, 338 and 402 in How Not to Age Citations
- [22] Castoldi F, Kroemer G, Pietrocola F. Spermidine rejuvenates T lymphocytes and restores anticancer immunosurveillance in aged mice. Oncoimmunology. 2022 Nov 14;11(1):2146855. doi: 10.1080/2162402X.2022.2146855. PMID: 36387057; PMCID: PMC9665084.Not referenced in How Not to Age Citations
- [23] Schroeder S, Hofer SJ, Zimmermann A, Pechlaner R, Dammbrueck C, Pendl T, Marcello GM, Pogatschnigg V, Bergmann M, Müller M, Gschiel V, Ristic S, Tadic J, Iwata K, Richter G, Farzi A, Üçal M, Schäfer U, Poglitsch M, Royer P, Mekis R, Agreiter M, Tölle RC, Sótonyi P, Willeit J, Mairhofer B, Niederkofler H, Pallhuber I, Rungger G, Tilg H, Defrancesco M, Marksteiner J, Sinner F, Magnes C, Pieber TR, Holzer P, Kroemer G, Carmona-Gutierrez D, Scorrano L, Dengjel J, Madl T, Sedej S, Sigrist SJ, Rácz B, Kiechl S, Eisenberg T, Madeo F. Dietary spermidine improves cognitive function. Cell Rep. 2021 Apr 13;35(2):108985. doi: 10.1016/j.celrep.2021.108985. PMID: 33852843. https://linkinghub.elsevier.com/retrieve/pii/S2211-1247(21)00299-0 Not referenced in How Not to Age Citations
- [24] Kiechl S, Pechlaner R, Willeit P, Notdurfter M, Paulweber B, Willeit K, Werner P, Ruckenstuhl C, Iglseder B, Weger S, Mairhofer B, Gartner M, Kedenko L, Chmelikova M, Stekovic S, Stuppner H, Oberhollenzer F, Kroemer G, Mayr M, Eisenberg T, Tilg H, Madeo F, Willeit J. Higher spermidine intake is linked to lower mortality: a prospective population-based study. Am J Clin Nutr. 2018 Aug 1;108(2):371-380. doi: 10.1093/ajcn/nqy102. PMID: 29955838. https://linkinghub.elsevier.com/retrieve/pii/S0002-9165(22)02930-6 Cited as references 339, 340, 341, 353. 357. 367, 372, 376, 380, 381, 388, 414, 416, 425, 431 and 4440 in How Not to Age Citations
- [25] Madeo F, Bauer MA, Carmona-Gutierrez D, Kroemer G. Spermidine: a physiological autophagy inducer acting as an anti-aging vitamin in humans? Autophagy. 2019 Jan;15(1):165-168. doi: 10.1080/15548627.2018.1530929. Epub 2018 Oct 11. PMID: 30306826; PMCID: PMC6287690. https://www.ncbi.nlm.nih.gov/pmc/articles/PMC6287690/ Cited as references 311 and 342 in How Not to Age Citations
- [26] Greger, M. (2023). How Not to Age: The Scientific Approach to Getting Healthier As You Get Older.