I came across this excellent image this morning. I will be crossing the High Sierras along the crest this summer.
Tag: Hiking
Which is the best place for hiking?

For me, it’s Mount Rainier National park, a large volcano of the Cascade volcano chain in North America. Why?
- I have been hiking here for 43 years, since I was a teenager. I have seen changes occur over the years: ice caves have closed, floods have occurred, roads have closed.
- My family and friends have had many great days on this mountain. I’ve never had anyone regret spending time here.
- Next, I have spent a good chunk of my life learning the flora, fauna, geology and ecology of this mountain region. There’s always something new to learn here.
- It’s also fairly easy for me to access. In fact, the local Cascade and Olympic mountains are why I live near Seattle, Washington.
- Exploring here is never boring. I have spent much of my time exploring the alpine areas above 2000 meters. There are also dense forests. fast moving rivers, lakes and many wonderful places. While not a mountaineer, I climbed the heavily glaciated 4392 meter summit in 2011.
- Finally, it’s just a place I love.
For each of us the answer’s going to be different. How would you answer this question?
PS – This was an answer I wrote on Quora, slightly edited, to this question:
https://www.quora.com/Which-is-the-best-place-for-hiking
Quantifying Hiking and Running Part 1
For the last eight years (2012-2019), I’ve been keeping tracking of my daily steps and miles using a pedometer. I realize there are better gadgets to do this: Fitbits, watches, and phones that will do this job with more data and better graphics. I like to “roll my own” and I thought I would write up what I have been doing. I welcome constructive feedback; my goal is to maintain and improve my fitness as I age through data analysis.
I record my mileage data daily and analyze my results weekly, monthly and yearly. Here is a link to my monthly and yearly mileage data in a Google Sheets file. In Table 1, I want to look at my mileage results on a yearly basis; I’ve also included my age. I can see that my mileage increased significantly after 2013, one reason for this is a greater emphasis on hiking and running. I can also see a drop in yearly mileage in 2016; this was due to some medical problems that required surgery, I had some months were I couldn’t exercise very much. In 2017 and 2018 I was training for ultra marathons and had increased my annual mileage. I find having yearly goals, such as races or long distance hikes, motivates me.
| Year | Miles | Age |
| 2019 | 3174 | 61 |
| 2018 | 3387 | 60 |
| 2017 | 3286 | 59 |
| 2016 | 2754 | 58 |
| 2015 | 3117 | 57 |
| 2014 | 3008 | 56 |
| 2013 | 2634 | 55 |
| 2012 | 2470 | 54 |
Here’s a summary of the mileage I’ve done month by month. Table 2 provides a monthly view of my mileage.
| Year | Jan | Feb | Mar | Apr | May | Jun | Jul | Aug | Sep | Oct | Nov | Dec | Year |
| 2019 | 301 | 241 | 289 | 242 | 238 | 250 | 273 | 269 | 276 | 280 | 274 | 242 | 3174 |
| 2018 | 318 | 271 | 315 | 252 | 304 | 315 | 272 | 338 | 229 | 301 | 240 | 232 | 3387 |
| 2017 | 256 | 296 | 298 | 259 | 286 | 295 | 288 | 283 | 214 | 291 | 281 | 240 | 3286 |
| 2016 | 187 | 188 | 193 | 215 | 206 | 225 | 238 | 267 | 267 | 305 | 269 | 194 | 2754 |
| 2015 | 245 | 258 | 260 | 244 | 266 | 281 | 247 | 306 | 255 | 250 | 237 | 269 | 3117 |
| 2014 | 224 | 211 | 239 | 206 | 212 | 253 | 282 | 302 | 265 | 267 | 275 | 273 | 3008 |
| 2013 | 210 | 190 | 208 | 229 | 243 | 238 | 256 | 220 | 221 | 209 | 199 | 211 | 2634 |
| 2012 | 147 | 201 | 184 | 192 | 242 | 238 | 245 | 190 | 200 | 213 | 202 | 214 | 2470 |
| Mean | 236 | 232 | 248 | 230 | 249 | 262 | 263 | 272 | 241 | 264 | 247 | 234 | 2951 |
For example, in the first three months of 2016 my mileage was lower than usual, these were months when I was recovering from surgery. Looking at the monthly mileage data, a high mileage month for me has been greater than 300 miles. For each month, I have computed the mean monthly mileage. My mileage tends to be lower in the shorter winter and early spring (December through April); the most likely cause is the dreary Pacific Northwest winters I manage to slog through each year. There are some exceptions such as 2018 when I was training for a 100 miler in the winter and 2019 when I spent time in South America during the winter.
Another way I like to view the monthly mileage data is a cumulative view. Table 3 shows the cumulative monthly data over the course of a year.
| Year | Jan | Feb | Mar | Apr | May | Jun | Jul | Aug | Sep | Oct | Nov | Dec |
| 2019 | 301 | 542 | 831 | 1073 | 1311 | 1561 | 1833 | 2102 | 2378 | 2658 | 2932 | 3174 |
| 2018 | 318 | 589 | 903 | 1155 | 1459 | 1774 | 2047 | 2385 | 2614 | 2915 | 3155 | 3387 |
| 2017 | 256 | 553 | 850 | 1109 | 1395 | 1690 | 1978 | 2261 | 2474 | 2765 | 3047 | 3286 |
| 2016 | 187 | 375 | 569 | 783 | 989 | 1214 | 1452 | 1719 | 1986 | 2291 | 2560 | 2754 |
| 2015 | 245 | 502 | 762 | 1006 | 1272 | 1553 | 1800 | 2106 | 2362 | 2612 | 2849 | 3117 |
| 2014 | 224 | 435 | 674 | 880 | 1092 | 1345 | 1627 | 1929 | 2194 | 2460 | 2735 | 3008 |
| 2013 | 210 | 400 | 607 | 837 | 1079 | 1317 | 1573 | 1793 | 2014 | 2223 | 2422 | 2634 |
| 2012 | 147 | 348 | 532 | 724 | 966 | 1205 | 1450 | 1640 | 1840 | 2053 | 2256 | 2470 |
The sum of all the yearly mileage is 23,831 miles over 96 months or 248 miles per month. Now, how does this compare to my goal performance?
In 2014, I decided to set a goal of 3000 miles in a year. A yearly goal of 3000 miles works out to an average of 250 miles per month or 8.22 miles per day. Before that, I had goals but they were haphazard. Here are my monthly goals for each year (adjusted for leap years.
| Year | Jan | Feb | Mar | Apr | May | Jun | Jul | Aug | Sep | Oct | Nov | Dec |
| 2019 | 255 | 485 | 740 | 986 | 1241 | 1488 | 1743 | 1997 | 2244 | 2499 | 2745 | 3000 |
| 2018 | 255 | 485 | 740 | 986 | 1241 | 1488 | 1743 | 1997 | 2244 | 2499 | 2745 | 3000 |
| 2017 | 255 | 485 | 740 | 986 | 1241 | 1488 | 1743 | 1997 | 2244 | 2499 | 2745 | 3000 |
| 2016 | 255 | 493 | 748 | 995 | 1249 | 1496 | 1751 | 2006 | 2252 | 2507 | 2754 | 3009 |
| 2015 | 255 | 485 | 740 | 986 | 1241 | 1488 | 1743 | 1997 | 2244 | 2499 | 2745 | 3000 |
| 2014 | 255 | 485 | 740 | 986 | 1241 | 1488 | 1743 | 1997 | 2244 | 2499 | 2745 | 3000 |
| 2013 | 255 | 485 | 740 | 986 | 1241 | 1488 | 1743 | 1997 | 2244 | 2499 | 2745 | 3000 |
| 2012 | 255 | 493 | 748 | 995 | 1249 | 1496 | 1751 | 2006 | 2252 | 2507 | 2754 | 3009 |
Once I had my goal and actual monthly mileage, I can compute the difference. A negative number indicates that I am less than my goal. Figure 1 shows the cumulative difference from goal over eight years.

Figure 1 shows five trends that are significant to me.
- January, 2012 to May, 2014 there is a negative slope: every month my actual monthly mileage was generally less than my goal of 250 miles per month./li>
- June, 2014 to December, 2015 the slope is mostly positive; my actual miles were greater than my goal of 250 miles per month.
- January to July, 2016 the slope is again negative; this is the period of time when I was recovering from surgery.
- mid-2016 until the end of 2018 I have been (mostly) exceeding my goal of 250 miles per month; the slope is positive with a few wintertime plateaus.
- For 2019, the slope is still positive but not as steep, I haven’t been traing for ultra marathons; only a trail marathon and lots of hiking
Keeping track of my monthly mileage difference from goal provides me some useful month to month feedback. Of course, I am motivated by numerical metrics; not everyone is. I have discovered there is a quantified self community; that discovery came just a few years ago. I welcome feedback from everyone. It’s good to learn from others!
I find that this feedback, along with yearly specific hiking or running goals such as run a 100 mile race or hike the Appalachian Trail (a 2020 goal) keep me on track and motivated.
In part 2, I will add my daily and weekly hiking and running goals and tracking methods.

Railroad Grade hike 14 August 2018
Railroad Grade is a hike that skirts the lateral moraine of the Easton glacier of Mount Baker. This was my first hike with the SnoKing Happy Hikers group; my friend Brenda introduced me to this fun group. The route starts with a walk in the woods and then a stream crossing on the trail to Park Butte. Luckily, the bridge was in place! After a few miles of walking, there’s an intersection; we turned upward on Railroad Grade. After about a mile of climbing, we took a side trail to the shaded High Camp area where I had nice lunch with Carol, Brenda and Ed. We saw lots of nature: marmots, butterflies and lots of intriguing plants.

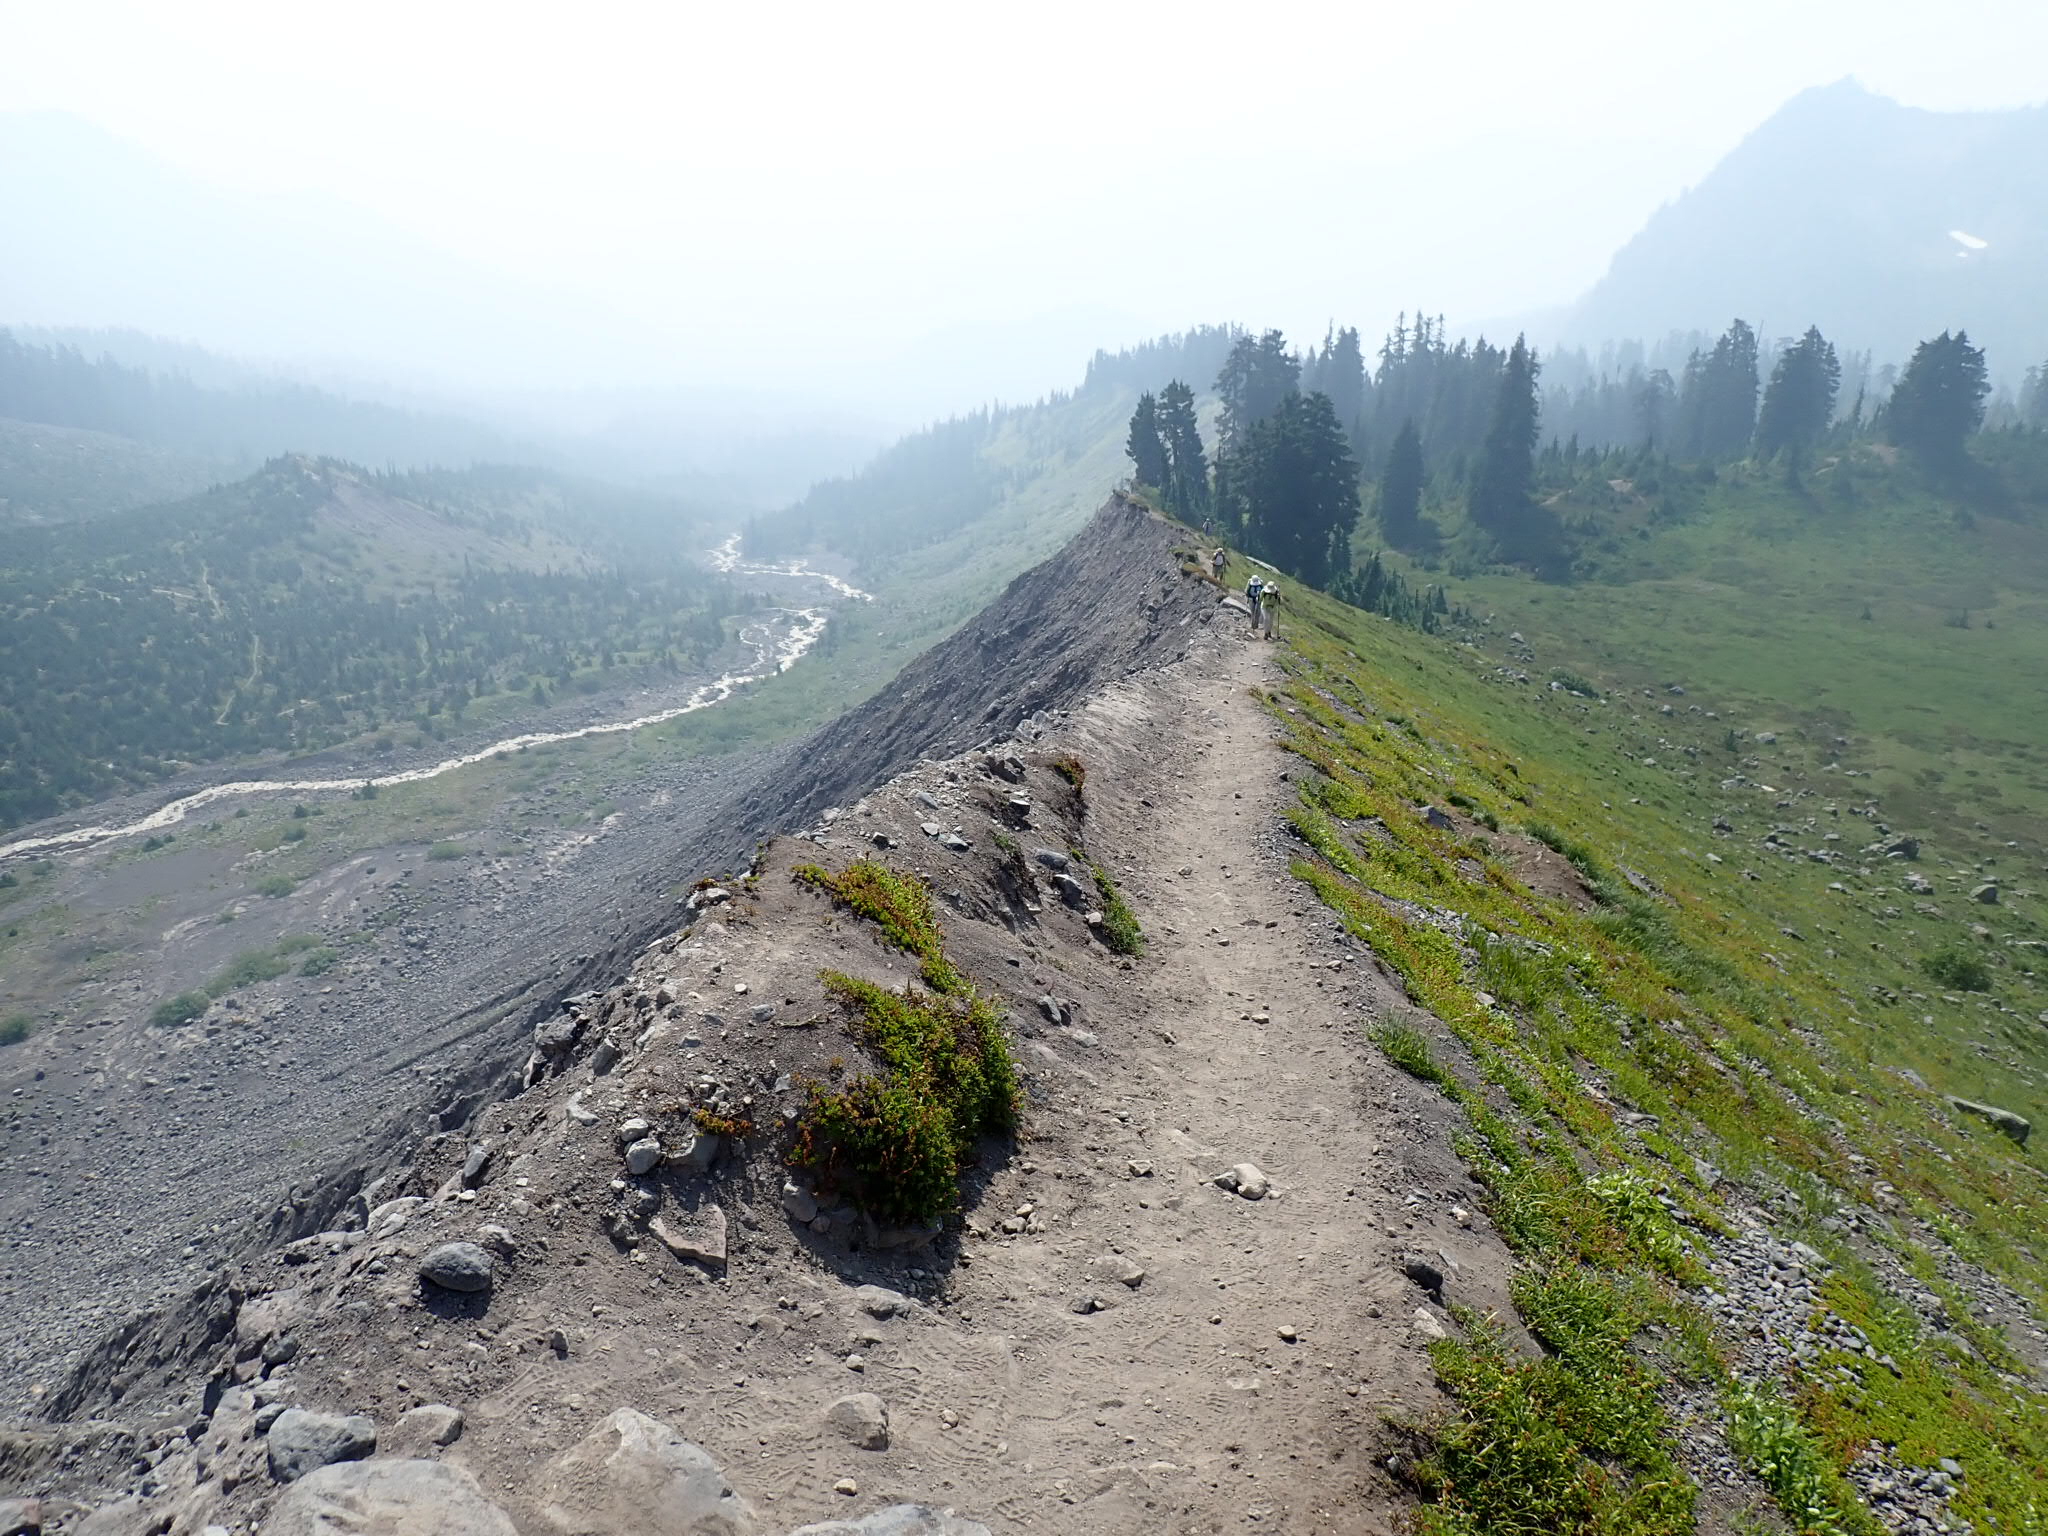
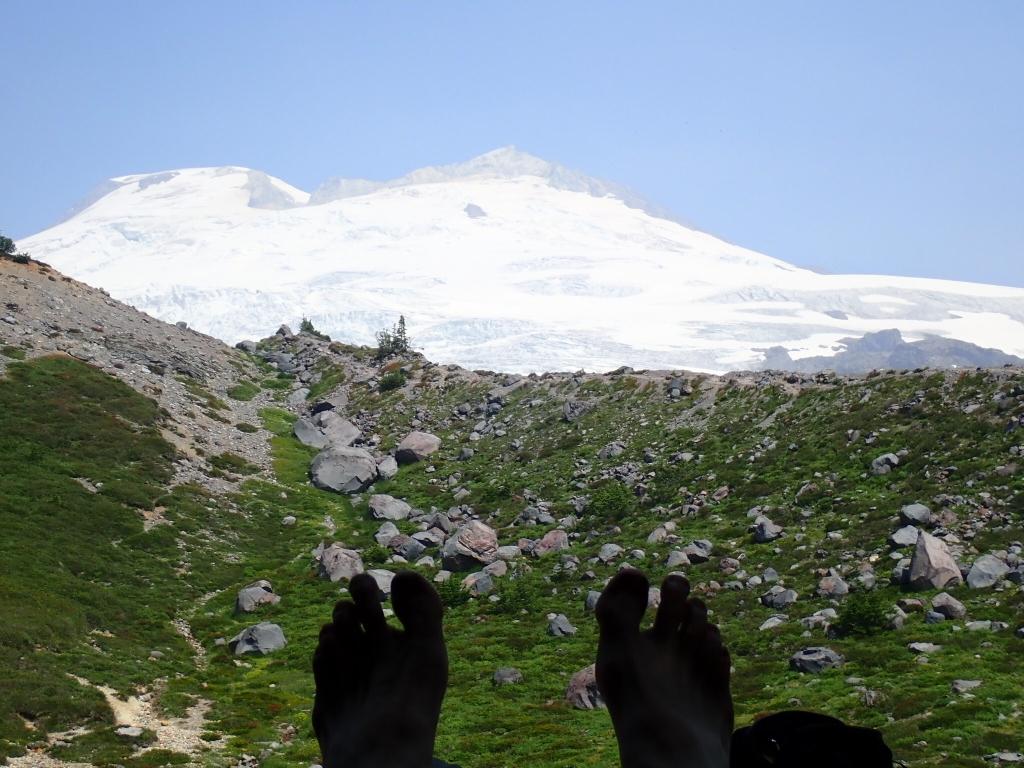
After lunch and a siesta, Brenda and I continued up to the trail to the climbers camp at 5800 feet. We explored this alpine, rocky area. We scrambled up the rocks alongside the glacier; I eventually went up to about 6400 feet while Brenda decided to stay a bit lower. We saw lots of climbers, many of them practicing climbing skills on Easton glacier. After a few hours up high, we descended down to the high camp area for dinner. We then decided to walk out. We had a little navigation challenge after crossing the bridge but after a few minutes we spotted the trail into the woods and out to the car. This was a great first hike with the Happy Hikers, a group I hope to do many more hikes with.
As I often do, I made a number of naturalist observations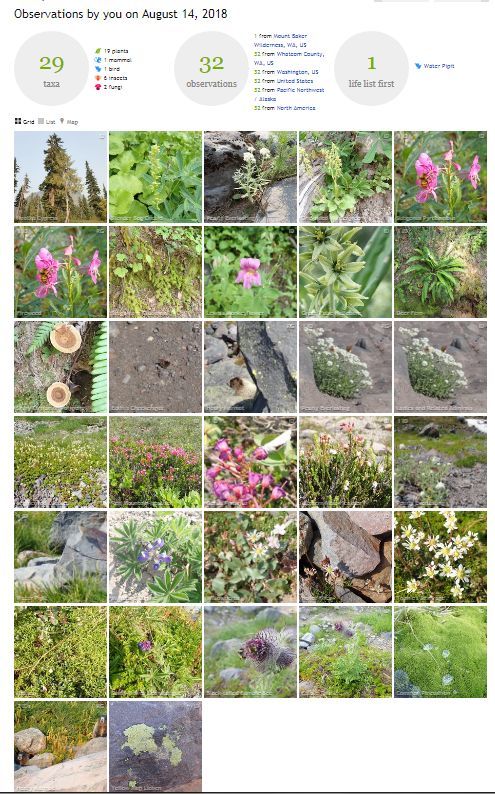

OLYMPUS DIGITAL CAMERA

OLYMPUS DIGITAL CAMERA

OLYMPUS DIGITAL CAMERA

OLYMPUS DIGITAL CAMERA

OLYMPUS DIGITAL CAMERA

OLYMPUS DIGITAL CAMERA
